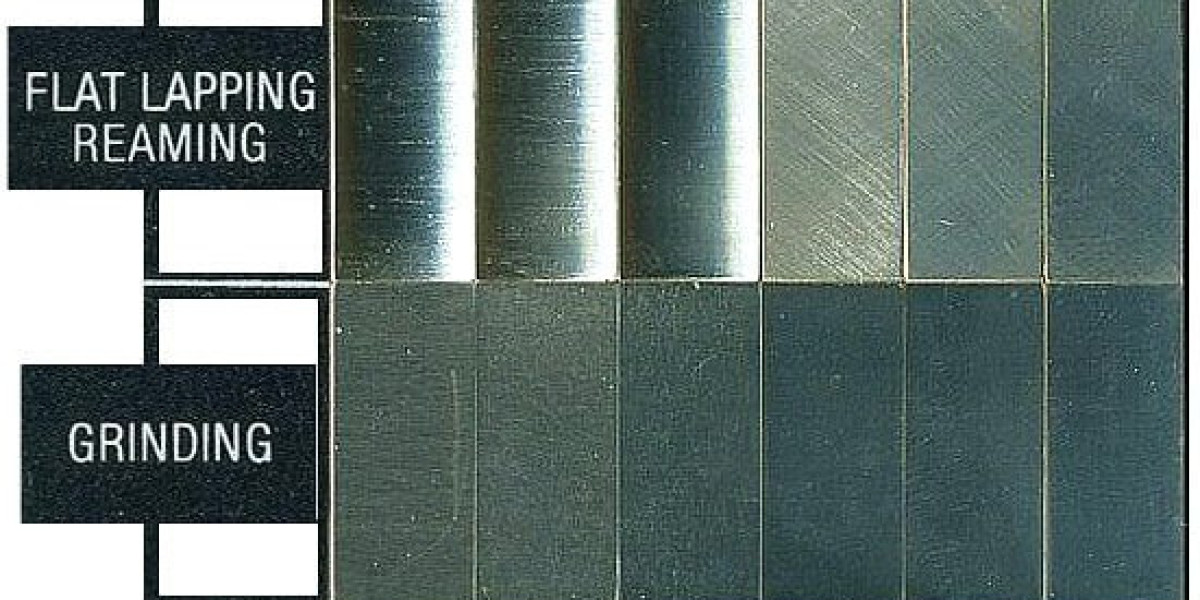
Introduction to Surface Finish Chart
In the world of manufacturing and engineering, the quality of a product’s surface finish is crucial. Whether it’s a metal part, plastic component, or any other material, the surface finish can influence a product’s performance, aesthetics, and durability. A surface finish chart is an essential tool for engineers, manufacturers, and designers in ensuring that the final product meets the required standards. In this article, we will explore the significance of surface finish charts, how to read them, their importance in manufacturing, and how they affect the overall quality of products.
What is Surface Finish?
Surface finish refers to the texture of a material's surface, resulting from the manufacturing process. It is a critical parameter that affects various factors, including:
- Aesthetic appeal: Smooth surfaces are often more visually appealing.
- Functionality: Some components require specific finishes to perform correctly (e.g., to reduce friction or improve grip).
- Durability and wear resistance: A well-finished surface can improve a material’s resistance to corrosion, wear, and fatigue.
Manufacturers employ different methods to achieve the desired surface finish, including polishing, grinding, machining, and coating. The surface finish chart is used to quantify these textures, helping professionals select the right process and achieve the desired results.
The Role of a Surface Finish Chart
A surface finish chart provides a standardized method to measure and specify the texture of a material’s surface. It visually represents the range of surface finishes that can be achieved during manufacturing. The chart uses specific measurements, usually expressed in micrometers (µm) or microinches (μin), to quantify the surface roughness, which includes the average height variation of the surface.
Manufacturers use these charts to:
- Define specifications: The surface finish chart helps define the required finish for a particular component based on its application.
- Ensure uniformity: It ensures that all parts produced are consistent in texture, regardless of the method used or the operator performing the task.
- Facilitate communication: The chart acts as a common language between designers, engineers, and manufacturers to communicate the exact surface requirements.
Key Parameters of Surface Finish
To fully understand a surface finish chart, it is important to know the key parameters used to define the quality of a surface finish. Some of the most common parameters include:
Ra (Roughness Average):
- Ra is the most common parameter used to specify surface roughness. It measures the arithmetic average of the absolute deviations of the surface profile from the mean line over a given length. Lower Ra values represent smoother surfaces.
- Example: A surface with Ra of 0.1 µm is much smoother than one with Ra of 3.2 µm.
Rz (Average Maximum Height of the Profile):
- Rz measures the average of the sum of the height of the highest peak and the depth of the lowest valley within a sampling length. It gives a broader view of the surface’s roughness compared to Ra.
- Example: Rz is particularly useful in applications where the peaks and valleys have significant functional relevance, such as sealing surfaces.
Rt (Total Height of the Surface Profile):
- Rt measures the total vertical distance between the highest peak and the lowest valley over the entire measurement length. It represents the overall roughness of the surface and can be useful in applications requiring high precision.
Rq (Root Mean Square Roughness):
- Rq is similar to Ra, but instead of averaging the deviations, it squares them. This gives more weight to larger deviations, making it a more sensitive measure of surface roughness.
- Example: Rq is useful when small irregularities or defects significantly impact the functionality of a part.
Waviness:
- Waviness refers to the more widely spaced deviations in the surface, often caused by factors like machine vibration or tool deflection. It is distinct from roughness, which refers to the smaller, finer deviations.
- Example: Waviness can affect the part’s overall functionality, such as in the case of seals or gaskets.
Surface Finish Chart Overview
A surface finish chart includes different categories of finishes that vary based on the type of manufacturing process and the required functionality of the finished part. Each category represents a specific range of surface roughness values, typically denoted as Ra values, ranging from ultra-smooth to rough surfaces. Here’s an overview of some common categories found in a surface finish chart:
1. Smooth Finishes (Ra 0.1–0.4 µm)
- Use: These finishes are required for components where friction is minimal, and aesthetics or minimal wear are important. Commonly found in optical lenses, medical devices, or precision machinery parts.
- Applications: Bearings, gaskets, surgical instruments, semiconductor components.
2. Fine Finishes (Ra 0.5–1.6 µm)
- Use: This finish provides a balance between smoothness and functionality, making it suitable for a range of general engineering applications.
- Applications: Electrical connectors, hydraulic systems, aerospace components.
3. Medium Finishes (Ra 1.6–3.2 µm)
- Use: This category is often used when surface friction is important, but the appearance is not critical. It provides adequate smoothness while also offering some grip for applications that require a bit more resistance.
- Applications: Automobile engine components, fasteners, and structural parts.
4. Rough Finishes (Ra 3.2–6.3 µm and higher)
- Use: Rough finishes are employed for parts that do not require a smooth surface, often for parts that will undergo further processing, such as coating or painting.
- Applications: Construction components, industrial equipment, and heavy machinery.
How to Read a Surface Finish Chart
To read a surface finish chart, follow these steps:
- Identify the desired surface texture: Determine whether the part needs a smooth, fine, or rough surface based on the application.
- Find the corresponding Ra value: The Ra value for the required finish will typically be listed next to the surface finish description. This value will give you the average roughness of the surface.
- Check the manufacturing process: The chart will often indicate which processes (e.g., grinding, milling, polishing, etc.) can achieve each finish. This helps in selecting the correct technique for manufacturing.
- Refer to other parameters if necessary: In some cases, other parameters like Rz, Rt, or Rq might be provided for specific applications. These values help refine the surface finish specification.
Importance of Surface Finish in Manufacturing
The quality of the surface finish plays a significant role in the performance and longevity of a product. Here’s why surface finish is essential:
Improved Functionality:
- For many components, especially in mechanical systems, the right surface finish is vital to ensure smooth operation, reduce friction, and avoid wear. A well-finished surface enhances the longevity of parts, as it reduces the chance of premature wear or failure.
Aesthetics:
- A smooth, polished surface can improve the appearance of a product. This is particularly relevant in industries such as consumer electronics, automotive design, and luxury goods manufacturing.
Material Properties:
- The surface finish can impact the material’s corrosion resistance, fatigue strength, and ability to hold coatings or lubricants. A poor surface finish may compromise the material’s resistance to rust or wear, reducing its overall performance.
Cost Efficiency:
- Choosing the correct surface finish can also impact the cost of manufacturing. While highly polished finishes might be necessary for some parts, they can be costly and time-consuming. Understanding the right finish for the job can help manufacturers optimize both quality and cost.
Conclusion
A surface finish chart is a vital tool in ensuring that the texture of a material’s surface meets the required specifications for a specific application. It helps manufacturers choose the right processes and materials, ensuring that parts function optimally, are durable, and meet aesthetic standards. Understanding the different surface finish categories, along with their corresponding roughness values, is crucial for quality control in manufacturing. By using the surface finish chart, manufacturers can produce high-quality, reliable products that meet both functional and visual standards.


